

Overview of Power BI Training in Qatar
Microsoft Power BI is a Data Visualisation software focusing primarily on Business Intelligence. It is an AI-powered, unified, scalable platform that helps you generate reports seamlessly. The usage of Microsoft Power BI is gaining popularity with each passing year as it easily converts raw data into engaging visuals.
Edoxi’s 20-hour Power BI course allows you to learn the tool according to your requirements and industry specifications. ce analysis and those who want to create comprehensive business reports as part of their future jobs. The course encompasses a Power BI project that will allow you to learn the tool most practically. In this course, you will learn,
- Advanced data modelling techniques, including complex relationships and hierarchies.
- Implementing advanced measurement tools for in-depth analysis and insights.
- Creating compelling visuals and reports.
- Publishing reports and dashboards to Power BI Service
As per your inquiry to enrol in the Power BI course, our salesperson will connect with you over a phone call. The salesperson will explain the details of the course, including schedules, fees, trainer details, and so on. You will meet the trainer in person and customise the training according to your requirements before starting the course.
Benefits of Our Power BI Course
- Advanced career opportunities: Power BI Training enables you to get job roles as a Business Analyst, Data Analyst, Data visualisation specialist, Financial Analyst, Marketing Analyst and so on.
- Get high-paying jobs: Our Power BI training equips you with technical skills that will prepare you for increased responsibilities and high-salaried jobs across the globe.
- Create efficient business reports: We equip you with skills to use data from various sources such as Excel, SQL, different databases, JASON, etc. to create extensive reports on multiple aspects of the business.
- Enhance problem-solving skills: You will acquire skills to identify business problems and solve them at the earliest. Thus, our training will improve your analytical and decision-making skills.
- Learn to create dashboards: You will visualise performance metrics, trends and patterns, comparison, real-time data, actionable insights and more.
Power BI Course Features
-
20-Hour Comprehensive Training:
We offer 20-hour comprehensive training, providing learners with up-to-date knowledge and skills required to master Power BI.
-
Interactive Learning Classes:
Our highly interactive training methodology provides an engaging and stimulating learning experience for the participants.
-
Project-oriented Training:
Participants will get the opportunity to work on Power BI projects that will make their learning more efficient.
-
Course Customisation:
The course will be customised according to your requirements and you can choose the project according to your field.
-
Beginner to Advanced Level Training:
The course will start from scratch to strengthen your fundamental knowledge of data visualisation and reporting.
-
Flexible Timing Options:
We provide individual attention to the participants and also offer flexibility in choosing class timings.
Industries Looking for Power BI Experts
IT Firms
Sales & Marketing
Financial Services
Healthcare
Education
Business Consultancy
Prerequisites For Joining Power BI Course
- Basic knowledge of MS Excel and Data Analytics is required.
Power BI Course Modules
- Module 1: Introduction to Self-Service BI solutions
- Introduction to Business Intelligence.
- Introduction to Data Analysis
- Introduction to Data Visualization.
- Overview and Considerations for Self-Service Bl.
- Microsoft Tools for Self-Service BI.
- Module 2: Introducing Power BI
- Explore the rationale of Power BI.
- Define the components of Power BI Service.
- Connecting to conventional Power BI Data sources.
- Create the first Power BI Report using non-Excel data.
- Introduction to advanced data sets (WEB, API, JSON, ODATA, etc.).
- Module 3: Power BI Data
- Using Excel as a Data Source for Power Bl.
- Exploring the Power BI Data Model. Using Online/Live Databases as a Data Source for Power BI.
- Importing Excel files into Power BI
- Viewing Reports from Excel Files.
- Exploring smart techniques to get data into Power BI from non-conventional data sets.
- Module 4: Shaping and Combining Data
- Power BI Desktop Queries.
- Power BI Visualization - Tables and Maps.
- Using Geographical Data in Visualizations.
- Shape and Combine Power BI Data - Mashup.
- Perform a range of query editing tasks in Power Bl.
- Shape data, using formatting and transformations.
- Combine data from tables in your dataset.
- Module 5: Modelling Data
- Defining the need for data Relationships and understanding cardinality.
- Introduction to DAX Queries.
- DAX Concepts - Row context & Filter context.
Calculations and Measures. - Create Relationships and describe relationships between data tables.
- Understanding logical Calculations.
- Understand the DAX syntax and use DAX functions to enhance your datasets
- Essential DAX functions - CALCULATE, FILTER, RELATEDTABLE.
- Working on Dates - developing date dimensions using Advanced M Query. O Create calculated columns, calculated tables, and measures.
- Important DAX Functions (Time Intelligence and Iterators).
- NOW, TODAY, DATE, DATEADD, DATEDIFF, TOTALMTD...QTD, YTD, SAMEPERIODLASTYEAR.
- Module 6: Interactive Data Visualization
- Creating Power BI Reports.
- Creating a Power BI Dashboard.
- Use Power BI Desktop to create interactive data visualizations.
- Manage a Power BI solution using Custom Visuals.
Import custom visuals into Power BI for use in Power BI reports. - Advanced visualization techniques - Synchronized filters and bookmarks.
- Advanced Power BI features - Filtering, Hierarchy, Drilldown, Tooltips.
- Module 7: Direct Connectivity
- Advantages of maintaining Cloud Data.
- Publishing Power BI data to the Cloud.
- Connecting to Analysis Services.
- Direct Connections to Power BI.
- Use Power BI with SQL Server Analysis Services data.
- Overview of online data sources ingestion (e.g., Google Analytics).
- Use Analysis Services models running in multidimensional mode.
- Module 8: Power BI Mobile & Web Services
- Using the Power BI Mobile App.
- Develop Mobile-compatible responsive reports and dashboards.
- Create dashboards and reports for mobile devices.
- Use Power BI Embedded to add visualizations and reports to web or mobile applications.
- Exploring Power BI Cloud services - Quick Insights, Usage Metrics, Report Scheduling.
- Developing reports using Power BI NLP features.
About the Power BI Project
In the Power BI course, you will undertake a practical project to make your learning more effective. Once you complete the project, you will be confident to implement Power BI in your project. We will customise the course and project according to your requirements. You can do projects in product sales data analysis, financial budgeting and planning, HR management, and so on. The structure of the project is as follows:
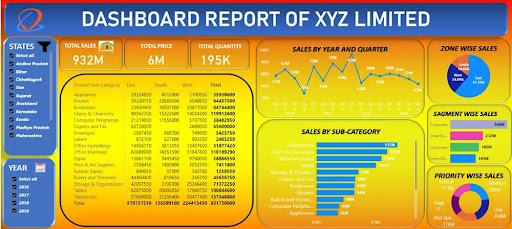
Product Sales Data Analysis: The project encompasses data importation, Power Query for cleaning and transformation, the establishment of relationships within the data model, utilisation of DAX for calculated columns and measures, creation of visually compelling visualisations, and finally, sharing and collaboration using Power BI Services. This hands-on approach offers an immersive learning experience and you will be able to do these activities in the project:
- Importing Data from different sources
- Cleaning data (Remove error and blank data, validation data type)
- Making connections between different tables
- Creating a variety of visuals (like- Columns, Bar, Donuts, Funnel, Maps, Lines and Decomposition Trees)
- Add Filter and Slicer to see data based on different criteria
- Creating Gauge, and KPI to put targets
- Using powerful tools like Tooltip, Drill through to put more information with any graph
- Publishing and sharing data with others
- Scheduling for auto-refresh data.
Similarly, you will do extensive projects in various fields, including financial performance analysis, marketing campaign insights analysis, healthcare sales analysis, AdventureWorks Database analysis, airport authority data analysis, educational data analysis, and so on. There are four major components of Power BI. You will learn how they employ the report during the course.
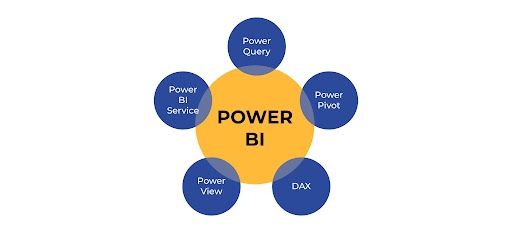
- Power Query: It is an ETL (Extract Transform and Load) where you can transform unclean data in a proper format.
- Power Pivot: It is used for data modelling where you can create relationships between different data.
- Power View: This is where you can visualise your data in more than 250 charts or visuals.
- DAX: Data Analysis Expressions (DAX) allows you to add calculated columns and Measures
- Power BI Service: This is where you share your report.
How to Get Power BI Certified?

Locations Where Edoxi Offers Microsoft Power BI Training
Here is the list of other major locations where Edoxi offers Microsoft Power BI Training
Microsoft Power BI Training in Dubai | Microsoft Power BI Training in Sharjah | Power BI Course in Muscat | Power BI Course in Kuwait | Power BI Course in Bahrain || CompTIA Training in Qatar | CompTIA Courses in Bahrain | CompTIA Courses in Riyadh | CompTIA Courses in Jeddah |
Upcoming Batches
| Time | 07.00 |
| Class Type | Live Training |
| Time | 07.00 |
| Class Type | Live Training |
| Time | 07.00 |
| Class Type | Live Training |
Review & Ratings

FAQs
Following are the job roles you can undertake once you get Power BI Certification
- Build professional-quality Business Intelligence Reports.
- Blend and transform raw data into beautiful Interactive Dashboards.
- Design and implement the BI tools used by professional analysts and data scientists.
Mentioned below are the areas covered in our Power BI Training in Qatar,
- Learn to collect, clean, model, and present data.
- Understand Business Intelligence workflow from end to end.
- Learn to create stunning Dashboards and Reports.
- Gain expertise to successfully implement Power BI in your organisation.
- Gain expertise in making Intelligence Reports and Dashboards from scratch to finish.
Mentioned below are the features of our Power BI Training
- Training will be based on the latest industrial standards and advancements.
- We offer customised training to corporate employees to meet the needs of their organisations.
- We follow flexible timing to meet your needs.
- We support your training by providing sufficient resources such as videos, books, and other study materials.
- Our course fees are nominal and affordable.
Yes, Data Analysts can be a part of Edoxi’s Power BI Training in Qatar. Data Analytics is the science of examining raw data to make conclusions about data. Many of the processes of data analytics are automated into mechanical processes and algorithms that work over raw information for human consumption.
The average salary of a Business Analyst in Qatar is QAR 36,225 Per Month.
Power BI is now used worldwide to connect disparate data sets, data visualisation and to get valuable insights within an organisation’s data. At Edoxi Training Institute we provide Power BI Training in Qatar by our Industrially trained experts and will guide you through extensive learning. Our comprehensive course will teach you everything you need to know to use Power BI. Newbies or Business Analysts who want to advance their skill sets can be a part of our training.
The following are the skills required for a business analyst,
- Analytical skills
- Problem-solving
- Critical thinking
- Reporting and documentation skills
- Interpersonal skills
- Communication skills
- Organising skills
- Data management skills
- Presentation skills